
Run cross-project reports
Reports turn what is happening across your projects into something you can scan in one view, hand to a stakeholder, or schedule to land in a mailbox every Monday. They live at Reports in the left sidebar and are available on every plan.
There are two flavors. Per-project Status Reports summarize one project for a specific week (great for sprint stand-ups, weekly emails, or executive updates on a single initiative). Cross-project Reports roll up data across every project you can see, with filters, grouping, and charts (great for portfolio reviews, billing reconciliation, and audit prep).
The four entity types
Section titled “The four entity types”The cross-project builder lets you pivot on any of four data shapes:
- Projects: name, type, status, progress, budget, spent, remaining, dates, member count, task count. The default columns for portfolio oversight.
- Tasks: title, status, priority, assignee, dates, estimated hours, parent project. Use this when you need to slice work by owner or due date across projects.
- Timesheets: user, project, task, date, hours, approval status, approver. The data shape for billing, utilization, and audit.
- Cross-project: one row per grouping dimension (by status, owner, portfolio, month, or governance score) with rolled-up project counts, task counts, average progress, summed budget, and member counts.
Build a report
Section titled “Build a report”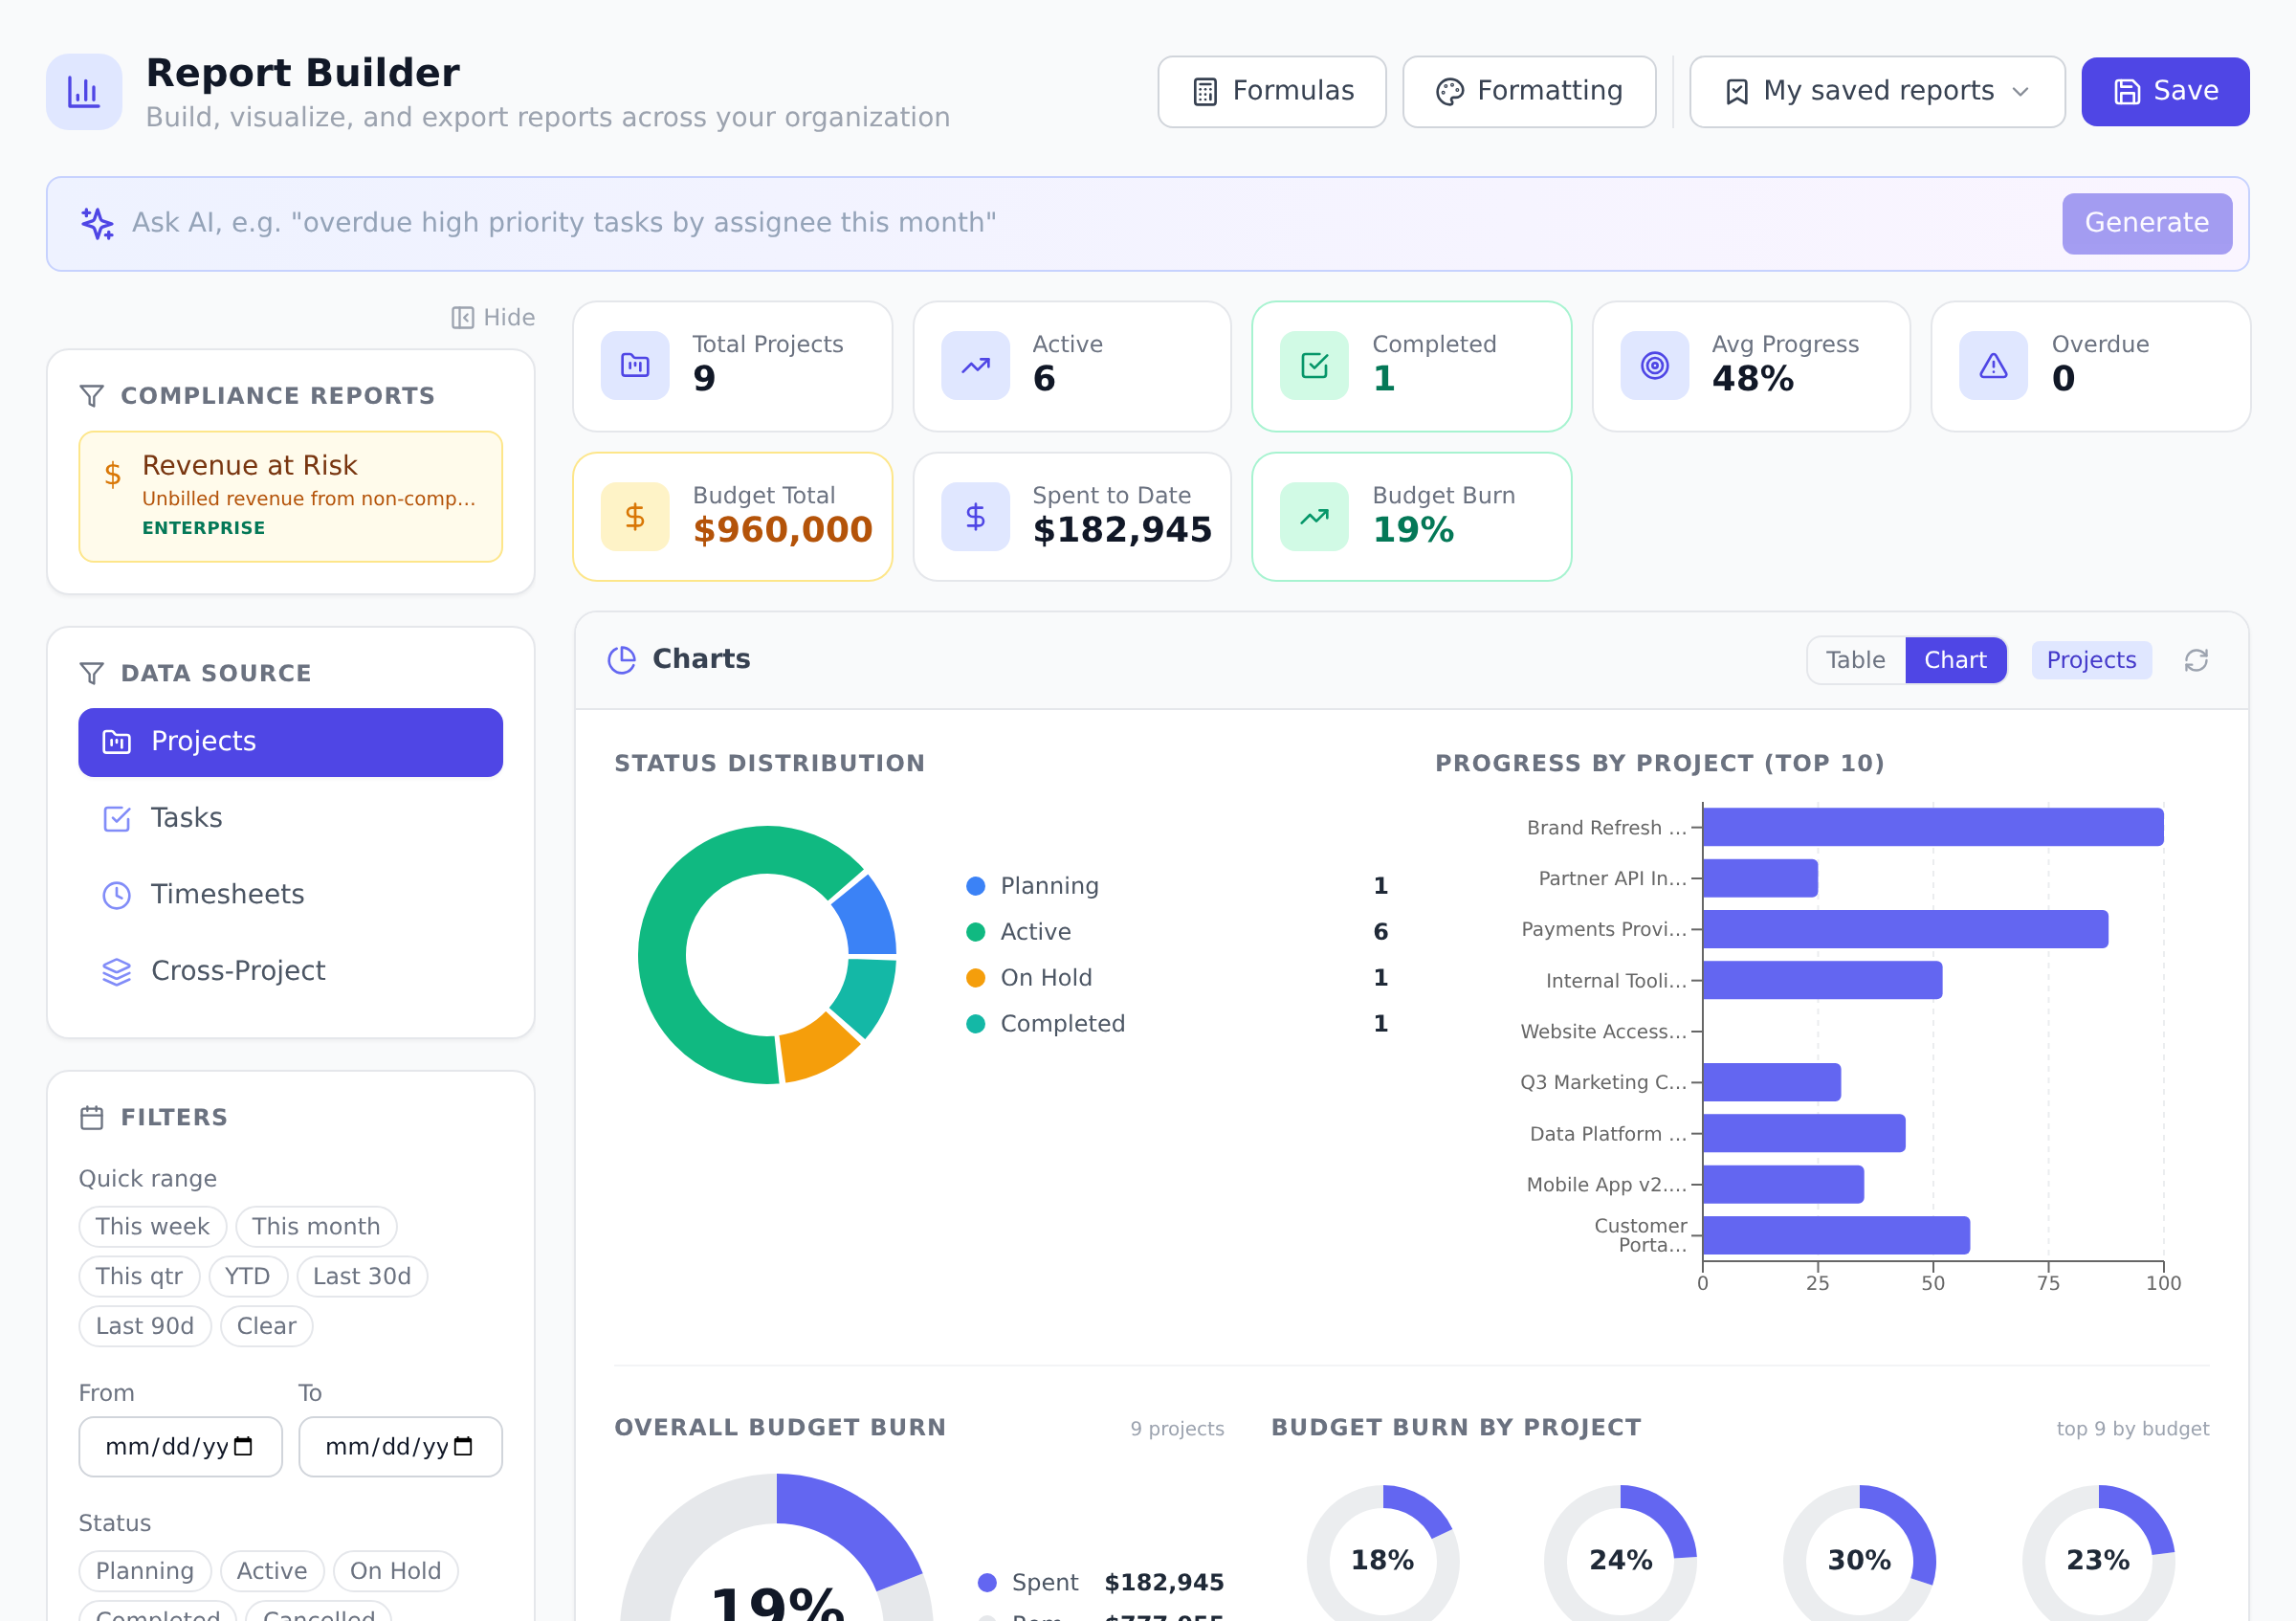
-
Open Reports in the sidebar.
-
Pick an entity type at the top. The available columns and filters update to match.
-
Set filters: status, type, billable, date range, assignee, owner, portfolio. Combine as many as you need.
-
Choose columns. Drag to reorder; clear the ones you do not want.
-
Switch between Table and Chart view. The chart shows bar or pie depending on the entity and grouping you picked.
-
Drill down on any row to see the underlying records that aggregate into it.
To start from one project instead, open the project and select View in Reports (in the Finance tab’s header, or the project’s More actions menu). The builder opens on the Tasks report filtered to that project, at an address you can share. See Read the EVM dashboard.
Save, schedule, and share
Section titled “Save, schedule, and share”A report is more useful the second time you run it.
- Save: name your current configuration and it appears in the Saved reports sidebar. Run it again with one click; edit the filters and re-save to refine it. Saved reports are scoped to your organization.
- Schedule: pick a cadence (daily, weekly, monthly) and a recipient list, and Onplana renders the report and emails it on that cadence.
- Share: generate a read-only public link with optional email unlock, or send it as an in-app message. See Share reports and documents externally for the full external-share flow and revocation controls.
Calculated columns and formatting
Section titled “Calculated columns and formatting”For analyzes the built-in columns do not cover, add:
- Calculated columns: define a column from a formula over existing
columns (for example,
budget - spentfor remaining headroom, or a utilization percentage). - Conditional formatting: tint cells red, amber, or green based on thresholds you set so problems jump off the page.
Both are saved with the report, so a scheduled delivery carries the same highlighting your dashboard does.
AI Status Reports
Section titled “AI Status Reports”The per-project Status Report view lets the AI assistant write the weekly narrative for you (what shipped, what slipped, what is at risk), grounded in the project’s own data. The output is editable before you send, and it draws from the same AI token budget as the rest of the in-app assistant. See Chat with Onplana AI for how that budget works.
Who can see my saved reports? Saved reports are visible to anyone in your organization who can open the Reports page, which today is every member of the organization (Guests cannot). Scheduling and sharing each have their own recipient controls.
Do reports honor project membership and permissions? Yes. Reports only include rows from projects you can already see. A member who is not on a project will not see its tasks or timesheets in a report, even if a colleague saved a report that included them.
Can I export to Excel or CSV? The cross-project endpoint supports export to CSV, and shared external report links render a printable view. For tabular formats beyond CSV, hit the public sharing flow and let the recipient export from their end.
Why is a Goal or Risk not showing up? Reports cover Projects, Tasks, Timesheets, and the cross-project rollup. Goals and Risks have their own dedicated pages and are not part of the Reports surface.
Related
Section titled “Related”- Build a custom dashboard, pin your most-used reports as widgets
- Share reports and documents externally, read-only links for stakeholders
- Track goals and OKRs, strategic rollups that complement task-level reports
Was this helpful?
Thanks for your feedback!