
Use the calendar and burndown views
Every PM eventually picks a calendar and a burndown chart as their “is this project healthy?” instruments. Calendar tells you when the work lands; burndown tells you whether the pace matches the commitment. Used together at the same standup or weekly review, they catch slippage roughly two weeks before it becomes a problem you have to explain to stakeholders. This article covers both, and the small discipline (look at the burndown shape, not just the position) that separates teams who catch slip early from teams who catch it late.
The calendar view
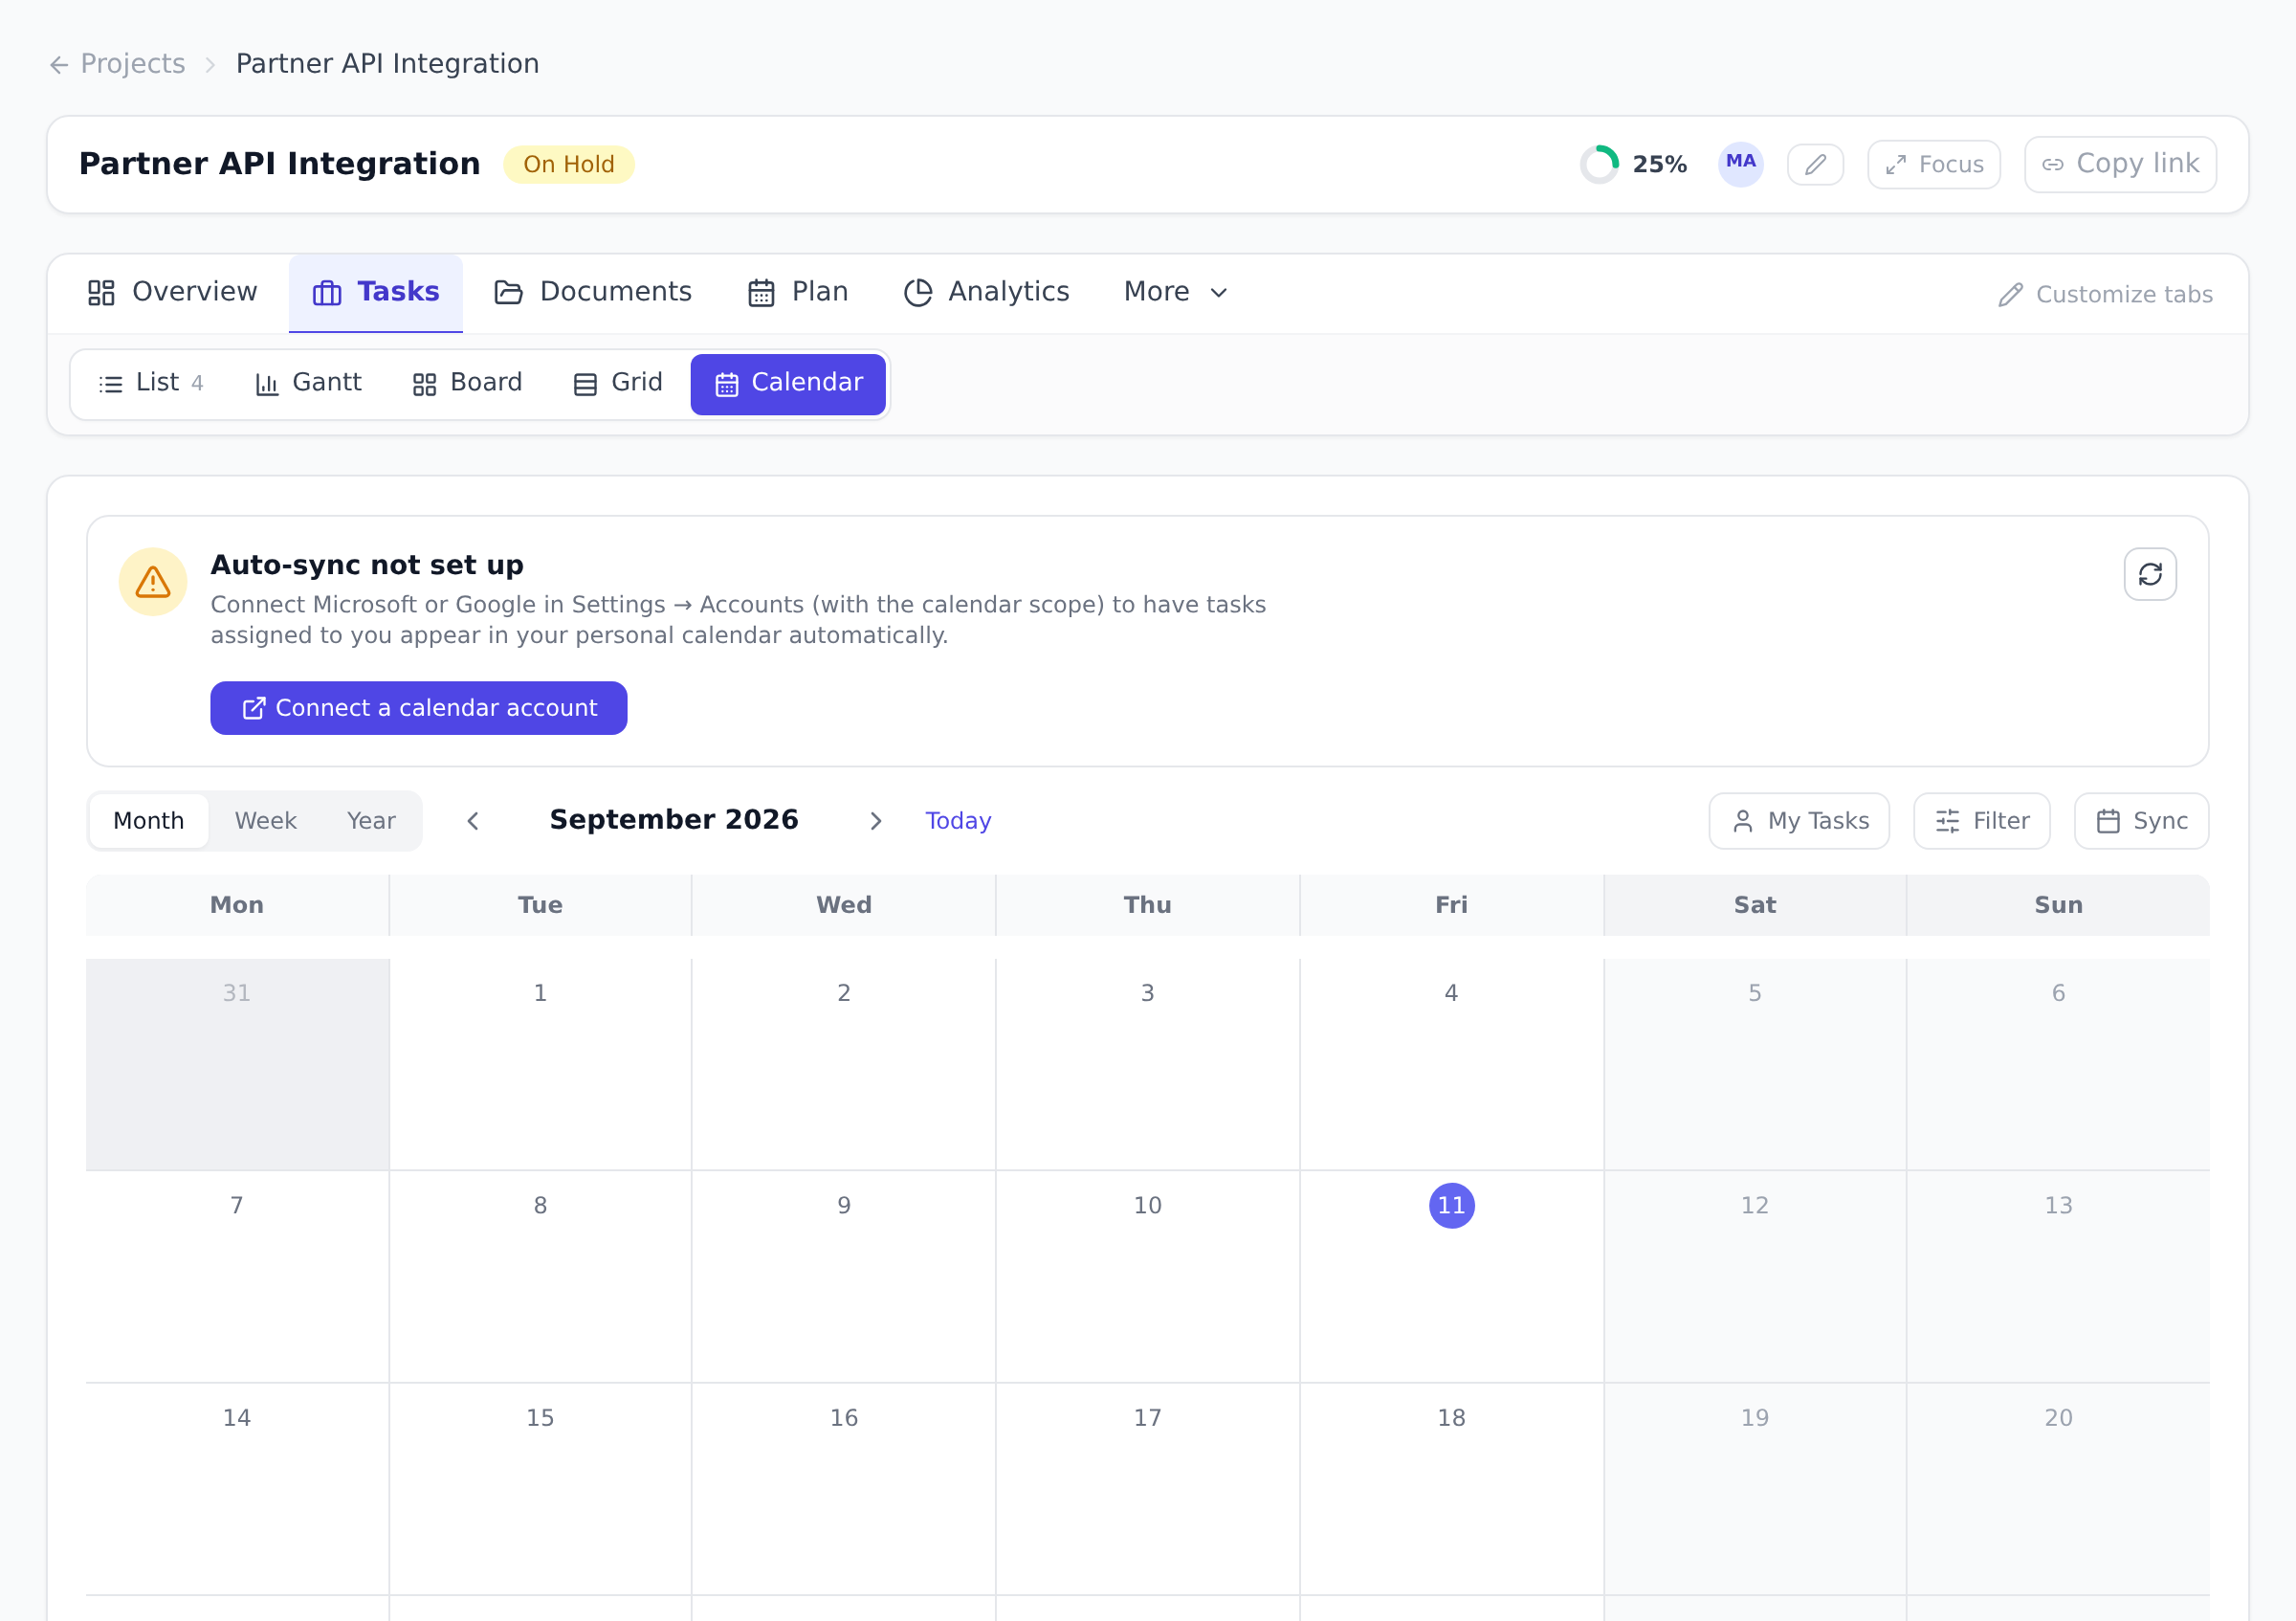
Section titled “The calendar view”Open a project, open the Tasks tab under the project header, and select Calendar. Tasks are placed by due date, and a task with both a start and a due date spans the days in between.
- Three zoom levels: month, week, and a year overview. The year view shows twelve mini-months shaded by how many tasks land on each day, which makes the crunch periods jump out.
- Filters: narrow the calendar by status or assignee.
- Overdue at a glance: a task past its due date and not yet Done is shown in red.
- Click to open: selecting a task on the calendar opens it for editing.
Tasks without a due date do not appear on the calendar; give them dates and they show up.
The burndown chart
Section titled “The burndown chart”Open the Plan tab under the project header and select Burndown. The chart plots the project’s remaining tasks over its date range:
- The ideal line is a straight descent from the total task count to zero at the project end date. You can toggle it on and off.
- The actual line shows how many tasks were really left on each day, drawn up to today.
- A today marker shows where you are in the timeline.
Reading it is simple: actual above ideal means the project is behind pace, actual below ideal means ahead. The shape matters too; long flat stretches mean nothing was finished, and a cliff right before a deadline usually means statuses were updated late rather than work happening late.
If your organization uses sprints (a Pro plan feature), the same view has a sprint selector that switches the chart to a per-sprint burndown for the sprint’s date range.
Best practices
Section titled “Best practices”- Read shape before position. Behind ideal is bad; flat for a week followed by a cliff is worse. The cliff means statuses were updated late rather than work finishing late, which destroys the chart’s predictive value for the rest of the project. Train the team to update status the moment a task moves, not on Friday afternoon.
- Use the assignee filter on the calendar before committing to new work. Five deadlines stacked on one person’s Thursday is invisible in a list and obvious on the calendar. Five seconds to verify saves an angry one-on-one later.
- Plot a sprint burndown next to the project burndown for sprint retros. The project chart shows whether the long-term pace is right; the sprint chart shows whether the sprint commitment was realistic. Disagreement between the two is informative. “Sprints land on time but the project is slipping” means scope is creeping faster than sprints can absorb it.
- Treat scope growth (the burndown line going UP) as the most valuable signal the chart provides. A rising line doesn’t mean you’re failing; it means scope is being honestly recorded. The team that hides scope growth by not creating tasks for new requests has a chart that lies.
- Use the year-view calendar at quarterly planning. Twelve mini-months shaded by task density makes seasonality obvious (crunch periods around contract renewal windows, holiday gaps, conference seasons). Easier to plan around what you can see.
Troubleshooting / common pitfalls
Section titled “Troubleshooting / common pitfalls”- My task doesn’t appear on the calendar. A task needs a due date to appear on the calendar. Either set a due date, or view in the Kanban board or list views which work without dates.
- The burndown stops at today even though I have future dates. That’s by design. The actual line is “what actually happened up to now,” so it ends at the current date. The ideal line continues to the project end so you can see whether the current pace will hit zero on time.
- My ideal line slopes the wrong way. The ideal line goes from total task count at project start down to zero at project end. If it slopes up, your project’s start date is after today (the chart shows the planned arc; you haven’t started yet) or your project’s end date is before today (no time left to burn down).
- The actual line jumped down sharply yesterday. Usually a large batch of tasks were closed at once (sprint end is a common trigger). The cliff is honest data, but if it happens repeatedly, the team is updating statuses in batches rather than continuously. See best practice #1.
- The calendar shows tasks the same color as my status, but I set them to a custom status. The calendar uses Onplana’s five built-in statuses (To Do, In Progress, Review, Done, Blocked); custom statuses you might have defined per-project aren’t yet color-coded on the calendar. They show in the task body when you click through.
How this combines with other features
Section titled “How this combines with other features”- Calendar + Working calendar. The org-wide working calendar defines non-working days; the project calendar respects it for the burndown’s date math. If your team works Sun-Thu instead of Mon-Fri, configure that in Working calendars first or the ideal line will compute against the wrong days.
- Burndown + Sprints. Each sprint gets its own burndown chart via the sprint selector on the same Burndown view. The per-sprint chart is the canonical retro tool. See Run and complete a sprint.
- Calendar + AI assistant. Ask the in-app AI assistant
“what’s due this week on
<project>?” or “is anyone overcommitted in week 47?”. It pulls the same data the calendar shows and renders the answer in chat. See Chat with Onplana AI. - Calendar + Custom Dashboards. A
milestone_timelinewidget on the Custom Dashboard pulls upcoming due dates across every project you choose, giving an executive view of “what’s landing across the portfolio”. See Build a custom dashboard.
Coming from another tool
Section titled “Coming from another tool”| Tool | Mapping |
|---|---|
| Microsoft Project Calendar view | Direct: tasks placed by due date with a similar three-zoom levels |
| Asana Calendar | Direct concept; Asana’s calendar is per-list; Onplana’s is per-project |
| Jira Calendar plugin | Onplana has the calendar built in; same monthly grid |
| MS Project Burndown chart | Project’s Tracking Gantt is closer; Onplana’s burndown is sprint-style (remaining vs ideal) |
| Trello Calendar Power-Up | Direct mapping; Onplana’s is native |
Why does my burndown go up? The remaining count rises when new tasks are added mid-project. That is scope growth being recorded honestly, and it is one of the most useful things a burndown shows.
Does the calendar let me drag tasks to new dates? No, the calendar is for reading the schedule and opening tasks. To reschedule by dragging, use the Gantt chart; otherwise edit the dates on the task itself.
Is the burndown weighted by task size? The project burndown counts tasks, so a large and a small task each move the line by one. For effort-weighted tracking, look at the project progress rollup, which weights by estimated hours when every task has one.
Can I export the calendar to my Outlook/Google calendar? The calendar view has a banner offering to connect a Microsoft or Google account. With it connected, your assigned tasks appear in your personal calendar with their due dates. The sync is one-way (Onplana → your calendar).
What time zone does the calendar use? The calendar respects your organization’s time zone setting (Organization Settings → General). Individual users currently see the organization time zone, not their personal one. If your team spans time zones, that matters at the boundaries.
Can two people compare burndowns side by side? Today the chart is one-project-one-sprint at a time. Cross-project burndown comparison lives in the Reports builder using the timesheet entity grouped by date.
Why doesn’t the burndown account for paused projects? A project on ON_HOLD status continues to draw the chart, there’s no way to pause the chart itself (Onplana doesn’t have a project archive state). The team generally prefers seeing the line stagnate during a pause as information rather than hiding it.
Related
Section titled “Related”- Plan on the Gantt chart, for actively rescheduling, use Gantt
- Use the Kanban board, the other daily-driver lens
- Run and complete a sprint, per-sprint burndown reading
Was this helpful?
Thanks for your feedback!