
Plan team capacity
The Capacity Planner shows every team member’s weekly availability next to the hours they actually logged, so you can spot who is over-allocated and who has room for more work before you assign it.
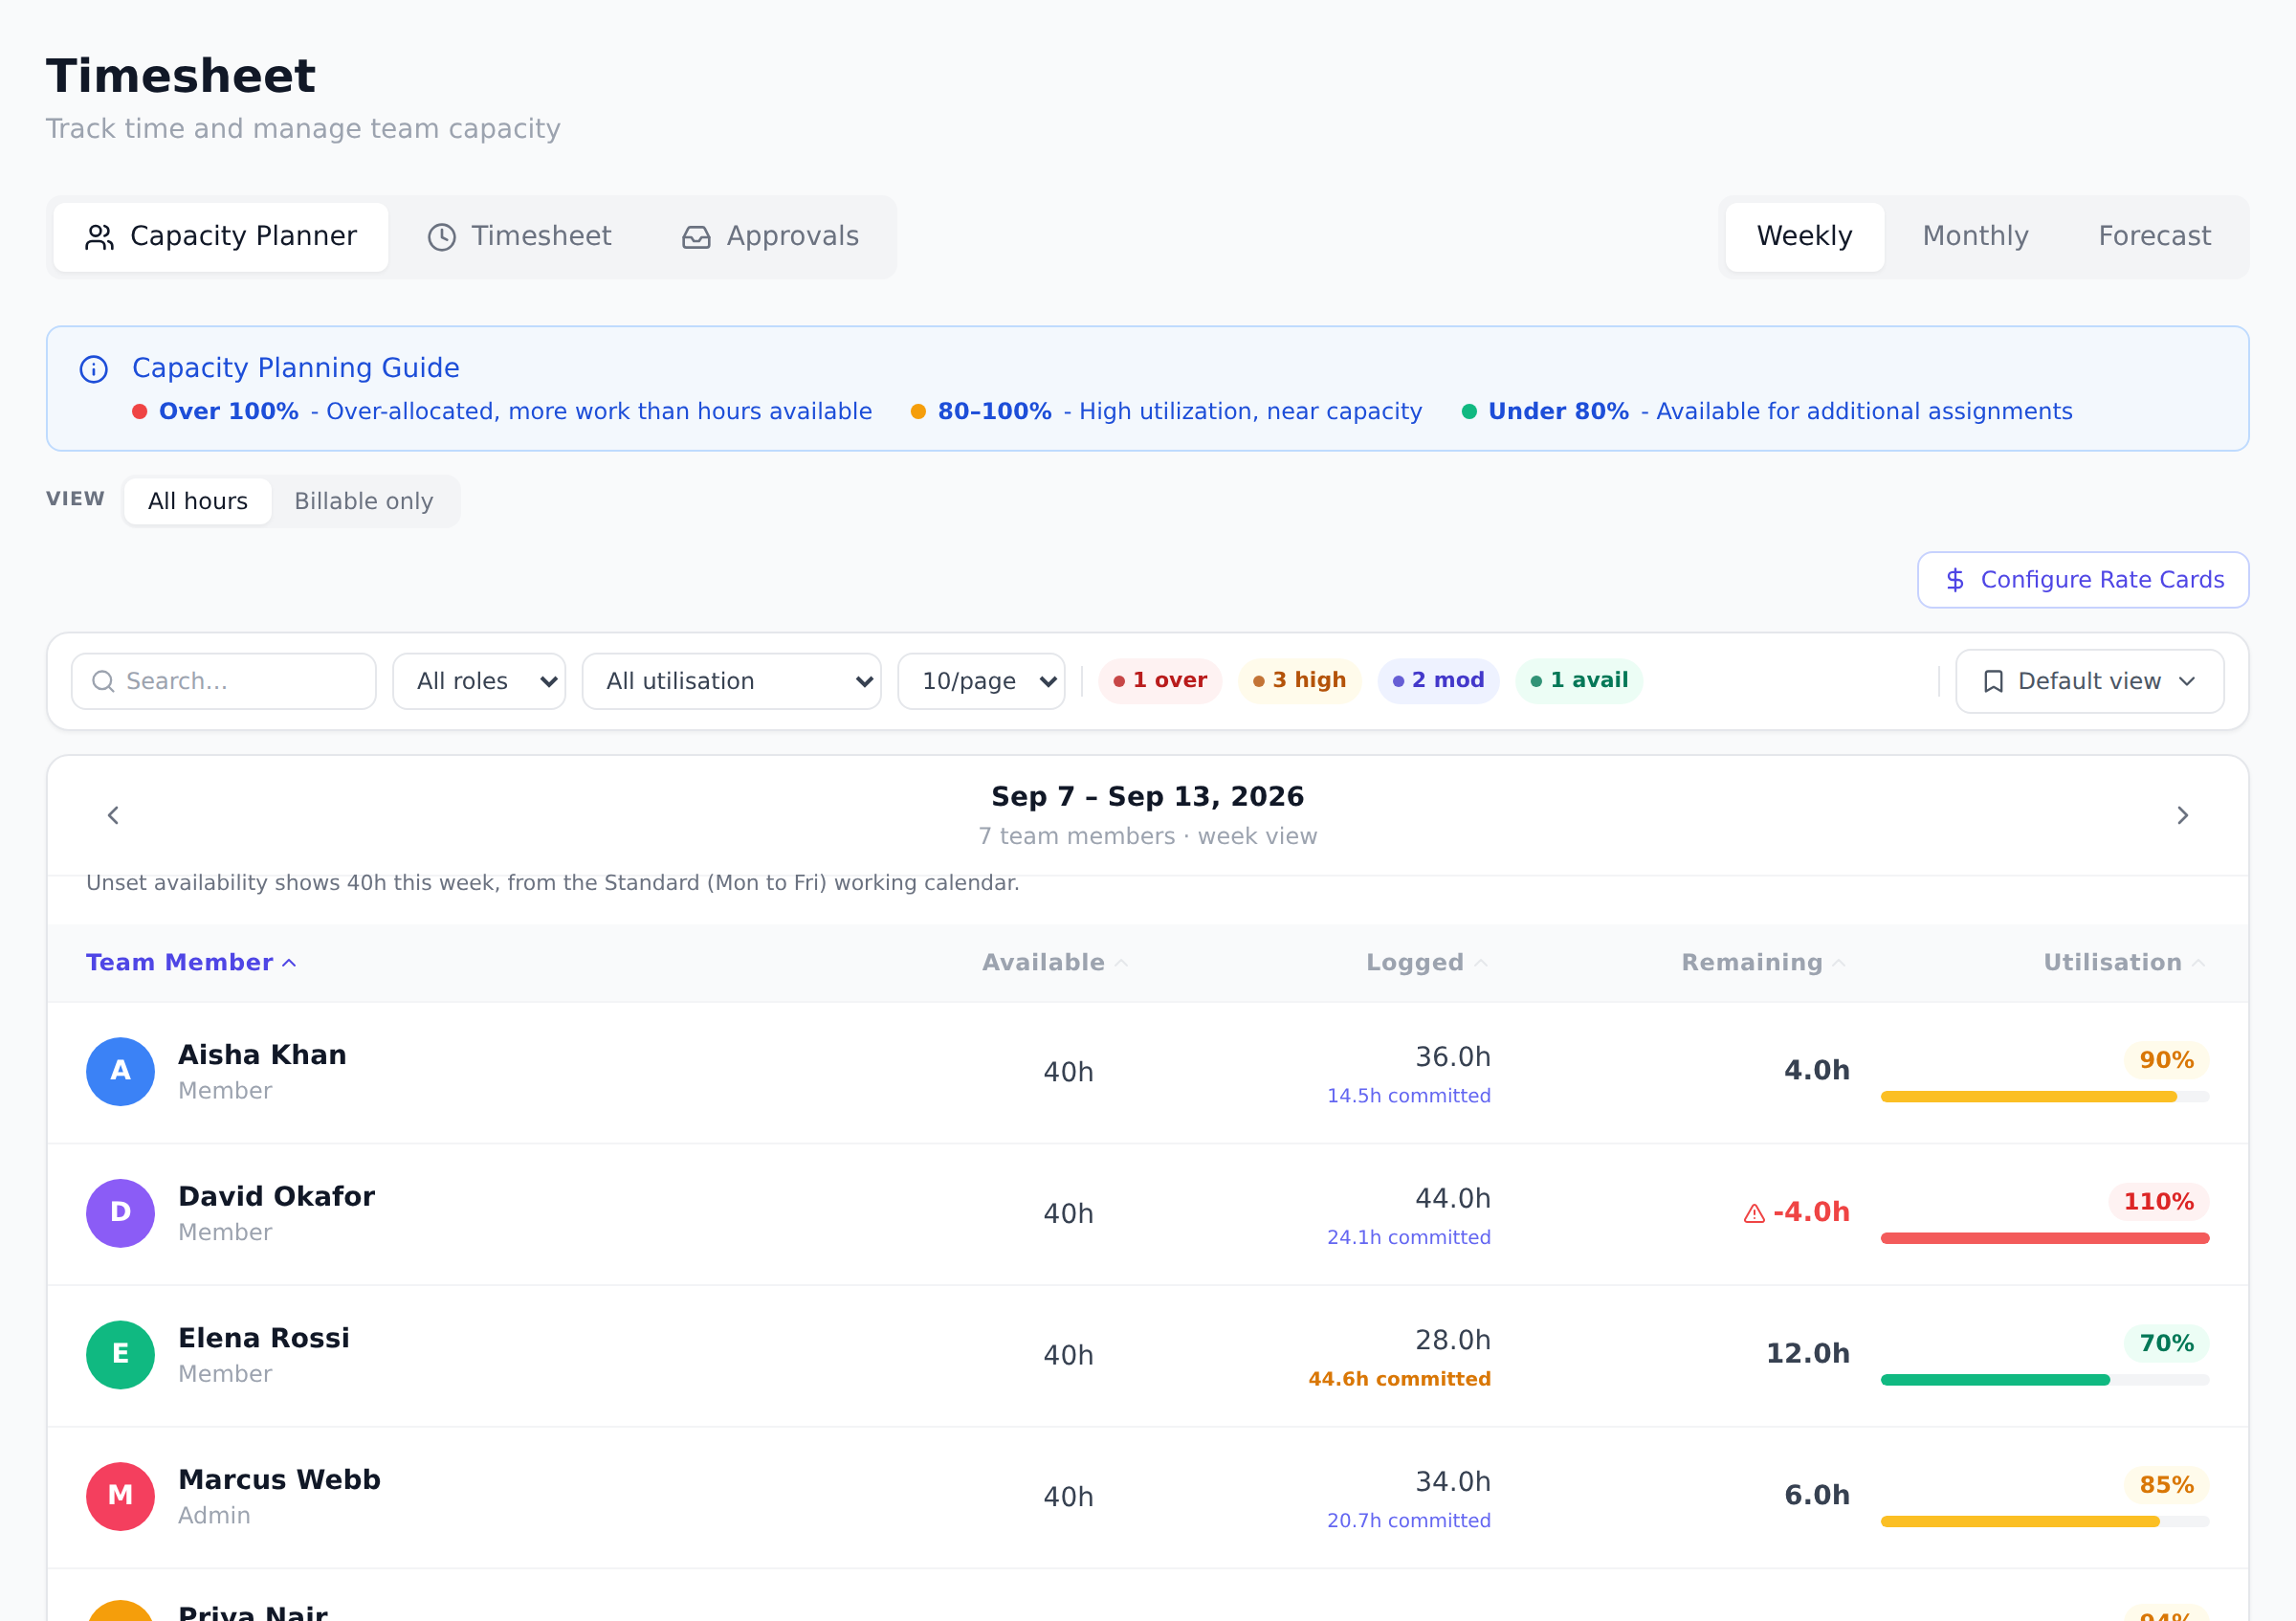
Open the Capacity Planner
Section titled “Open the Capacity Planner”-
Select Timesheet in the sidebar.
-
Switch to the Capacity Planner tab. This tab is visible to Owners, Admins, and Portfolio Managers; team members see only their personal Timesheet tab.
-
Use the Weekly / Monthly toggle at the top right to change the period. Weekly shows one editable week; Monthly aggregates the weeks of the current month.
The filters and sort here can be saved as a named view from the views menu beside them, starred to load automatically, exactly as on the Projects page. See Save your filters as a view.
Set each person’s available hours
Section titled “Set each person’s available hours”In the Weekly view, click a person’s value in the Available column and type their hours for that week. Availability is stored per person, per week, so part-time schedules, ramp-up weeks, and vacation weeks can all differ. Anyone without a value defaults to what the organization’s default working calendar says that week is worth (40 hours for the standard Monday-Friday, 8-hour calendar), automatically reduced on weeks that contain a calendar holiday.
Read the utilization signals
Section titled “Read the utilization signals”Utilization compares logged hours against available hours, so the bands describe what someone has recorded, not what they are holding. The in-page guide explains the colors:
- Over 100%: recorded more hours than they had available.
- 80–100%: high utilization, near capacity.
- Under 80%: room left in what they have recorded so far.
The toolbar lets you search people, filter by role, and filter by utilization band.
For “who can take on more this week”, read the committed figure below rather than the band. Someone can sit under 80% and still be full.
Committed hours
Section titled “Committed hours”Beneath each person’s logged hours sits a second figure, Nh committed: the work already assigned to them for that week. This is the number that answers whether they have room, and it turns amber once it passes their available hours.
Logged and committed are kept separate on purpose, because they are two different facts. Somebody who has recorded nothing yet and has sixty hours of tasks booked for next week is at 0% utilization and heavily committed at the same time. Blending the second into the first would quietly change what every utilization band, filter, dashboard widget and compliance figure in the product means, so it sits alongside instead.
What counts as committed
Section titled “What counts as committed”Every task assigned to that person that is not Done, Blocked ones included. Blocked work is still owed, and treating it as free capacity is exactly how a stuck person comes to look available.
A task’s estimate is spread evenly across its calendar days, and only the portion falling inside the week is counted. A two-week task contributes half its estimate to each of those weeks rather than its whole estimate to both, which would make anyone holding a long task look permanently overloaded.
Approved time off comes off the available side, so a person on leave shows less capacity that week rather than the same capacity they would have had at their desk.
What cannot be placed, and is said out loud
Section titled “What cannot be placed, and is said out loud”A task with no estimate, and a task with no dates, cannot be put in a particular week. Dropping them quietly would make a loaded person look free, so they are reported next to the figure instead, as N unestimated and N undated. Read the line as “this much committed, plus these”.
At the moment of assignment
Section titled “At the moment of assignment”The same arithmetic appears where the decision is actually made rather than in a report someone would have to go and open. Pick an assignee on a task and a line under the picker reads “Sam would be at 34h of 40h in the week of Sep 8, 2026.” Hand them more than the week holds and it turns amber, adds the percentage, and lists Other work that week, largest first, so “what would have to move” is answerable without leaving the form.
Two details of that list are deliberate. Work in projects you cannot open is counted in the total but never named, because a task’s title is that project’s content and does not become yours to read just because you share a person. And when you are editing a task that is already assigned, its hours come out of the week before the values currently in the form are added back, so it is never counted twice.
The line needs an assignee and at least one date to have a week to report on. On Free and Starter there is no capacity data behind it, so it renders nothing at all rather than an upsell.
All hours vs Billable only
Section titled “All hours vs Billable only”The View toggle above the table switches between All hours and Billable only:
- All hours counts every logged hour toward utilization.
- Billable only counts only hours logged on projects marked billable, and shows utilization against client-billable work alone.
The layout does not change; only the logged-hours and utilization columns recompute. This is the quickest way to separate “busy” from “busy on client work.”
Best practices
Section titled “Best practices”- Set availability before the week starts, not after. Capacity drives compliance expected hours, forecast math, and assignment decisions. Setting it Monday morning shapes the week; setting it Friday evening describes the past.
- Account for vacation, conferences, and other non-billable time in availability, not utilization. A person on vacation has 0 available hours that week, not 40 available with low utilization. The distinction makes utilization meaningful.
- Use the Billable Only view for client-services utilization targets. Most consultancies target ~75-85% billable utilization. The toggle lets you read directly against that target rather than discounting non-billable in your head.
- Filter by utilization band during weekly capacity planning. “Who’s under 80%?” is the right question for “who can take more work this week”; “Who’s over 100%?” is the right question for “who needs help getting unblocked?”. The filter is faster than scanning.
- Pair Capacity with Sprints for hourly commitment. A sprint’s estimated-hours total should fit the team’s available hours for the sprint window. Capacity tells you the available side; the sprint plan tells you the committed side. They should approximately match.
Troubleshooting / common pitfalls
Section titled “Troubleshooting / common pitfalls”- A person’s row shows 40 hours even though they’re part-time. The org’s default working calendar fills in hours when none are set (40 for the standard calendar). Edit the row to reflect actual availability.
- Utilization shows over 100% but the person isn’t burned out. Check whether (a) logged hours include non-work entries (e.g. someone forgot to mark training as billable); (b) availability was set too low for that week (vacation that didn’t happen). The fix is at the data layer, not the math.
- The Billable Only view shows 0 for everyone. No project on which they logged hours is marked Billable. Verify the Billable flag on the Projects page; see Mark projects billable or internal.
- Monthly view doesn’t reflect this week’s edits. Monthly aggregates already-saved weeks. If you edited but the change didn’t save (you navigated away without clicking save), the edit was lost.
- A team member can see the Capacity Planner tab. They probably have a manager-tier role. Check Settings → People → permissions.
How this combines with other features
Section titled “How this combines with other features”- Capacity + Compliance. The expected weekly hours used in compliance can pull from the Capacity Planner’s availability, so part-time team members aren’t unfairly compliant against a 40-hour bar. See Set expected hours overrides.
- Capacity + Sprints. Sprint commitment in estimated hours should fit team available hours. The Capacity Planner shows the available side; the sprint board shows the committed side.
- Capacity + Forecast. Forecast projects the availability you set here across the next 4 weeks, and estimates the billable share of it from the last 4 weeks of logged time. Adjust availability for known future weeks and the Forecast updates. See Forecast billable capacity.
- Capacity + Rate cards. Available hours × billable rate = potential billable revenue. Capacity Planner doesn’t show this directly, but Reports can model it.
Coming from another tool
Section titled “Coming from another tool”| Tool | Mapping |
|---|---|
| Microsoft Project Online Resource Center | Direct concept |
| Smartsheet Resource Management | Direct |
| Float | Single-purpose tool; Onplana integrates capacity with the rest of PM |
| Resource Guru | Similar weekly availability model |
| Tempo Resource Planner (Jira) | Similar |
Who can edit available hours? Owners, Admins, and Portfolio Managers can edit any row in the Weekly view. Monthly view is aggregated across weeks, so editing happens in Weekly only.
What happens on plans below Pro? The Capacity Planner is part of resource management, which is included from the Pro plan up. Below that, the Capacity tab shows an upgrade notice instead of the planner.
What makes a project count as billable? The project’s Billable flag, set on the Edit Project form. Hours logged to billable projects feed the Billable only view and the billable utilization figures.
Can team members see each other’s utilization? No. The Capacity Planner tab is hidden for the Member and Guest roles; they see only their own timesheet.
Can I set bulk availability for a holiday week? Not as a single action today. Set each person’s row individually. A copy-paste workflow (set one to 0, copy that value across rows) is the fastest path.
What does a person on vacation look like? Available 0, Logged 0, Utilization n/a. The math accommodates zero-available weeks gracefully.
Does availability respect the org-wide working calendar? Default 40h/week assumes Mon-Fri 8h. Custom availability overrides this for that week. Org-wide calendar holidays reduce default available hours on the affected weeks.
Related
Section titled “Related”- Record time off, how leave comes off the available side
- Log and submit timesheets, the source of “logged” hours
- Set expected hours overrides, capacity-aware compliance bars
- Forecast billable capacity, extending availability forward
Was this helpful?
Thanks for your feedback!