Read the EVM dashboard
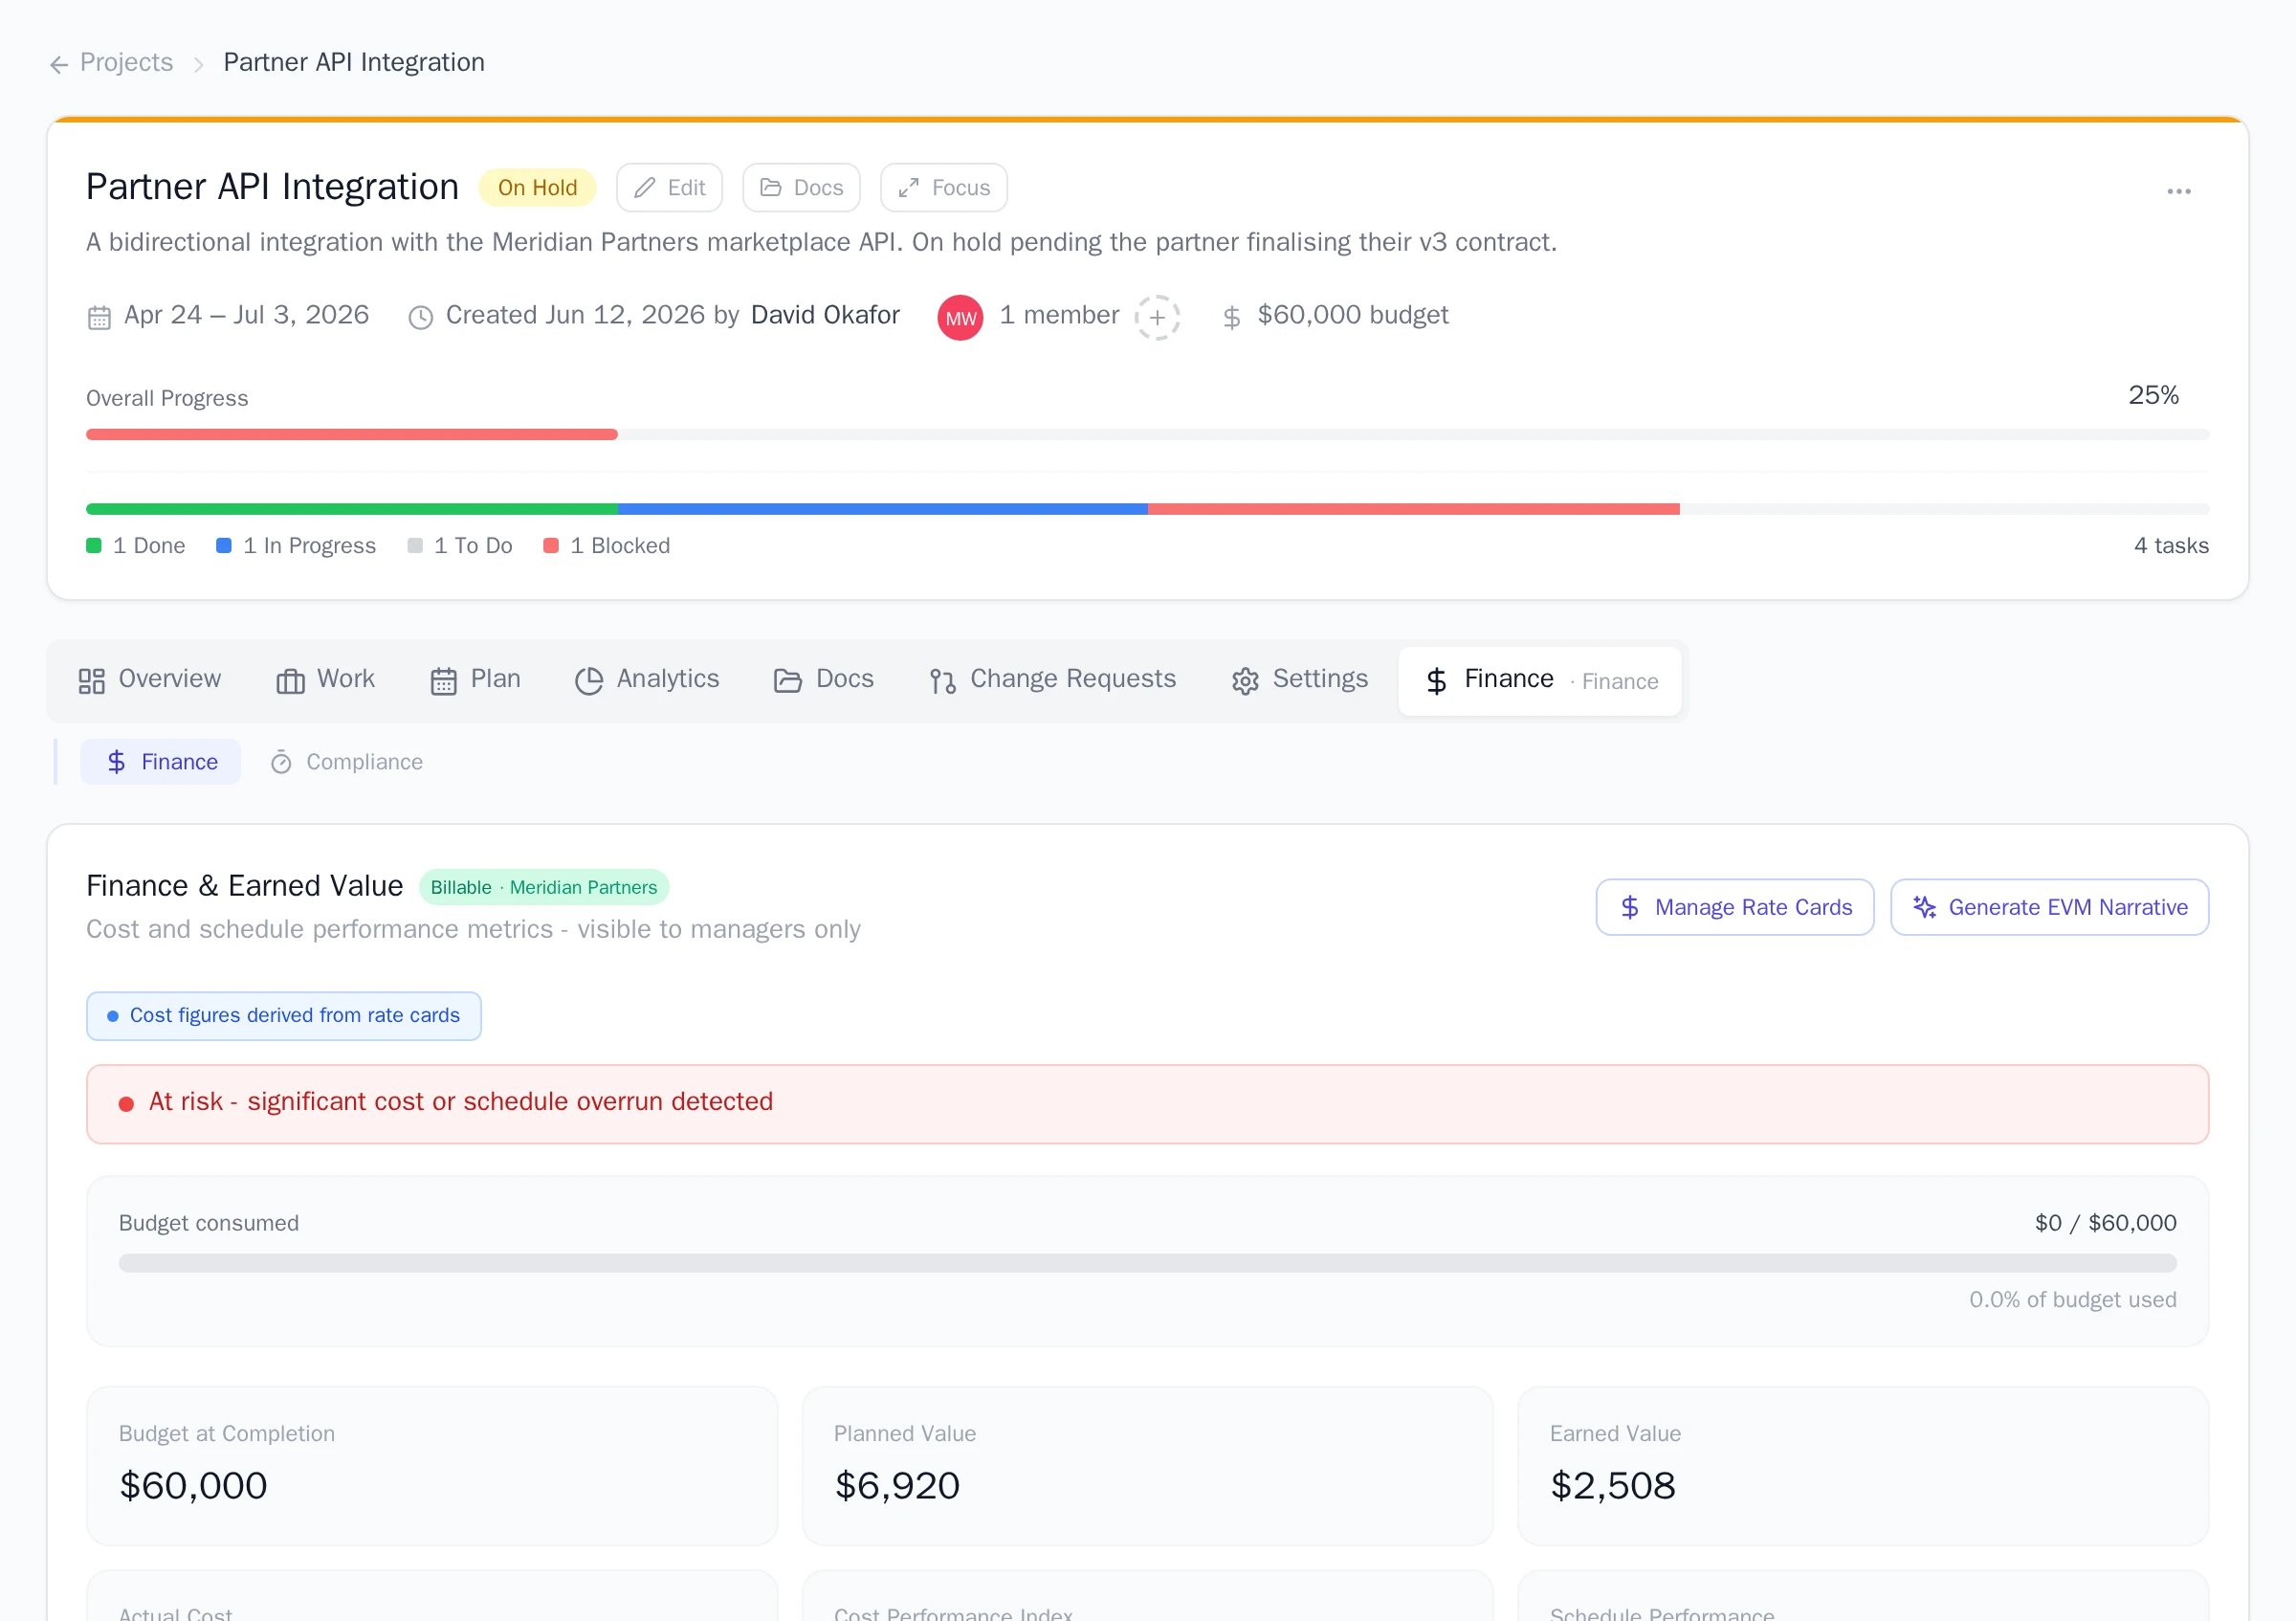
Every project has a Finance tab with classic earned value management (EVM): is the project on budget, and is it on schedule? It is visible to project managers and organization owners and admins; regular project members do not see finance data.
Where the numbers come from
Section titled “Where the numbers come from”A badge under the header tells you which signal the cost figures are built from:
- Cost figures derived from rate cards: planned cost is each task’s estimated hours times the assignee’s resolved rate, and actual cost is logged timesheet hours times rates. If timesheet approval is enabled for your organization, only approved entries count toward actual cost, and rejected entries never count.
- Cost figures imported from Microsoft Project: when most of the project’s tasks carry cost values from a Microsoft Project import, those imported values are used directly. Tasks without an imported cost still fall back to rate cards.
If the project has neither rate cards nor imported costs, the tab shows an empty state instead of inventing dollar values. Set up rate cards or a default hourly rate and it populates on the next refresh.
The metric cards
Section titled “The metric cards”- Budget at Completion: the total approved budget.
- Planned Value: the cost of work scheduled to be done by now.
- Earned Value: the cost-weighted value of work actually completed.
- Actual Cost: money spent to date, from timesheets times rates.
- Cost Performance Index (CPI): earned value divided by actual cost. Above 1.0 means under budget.
- Schedule Performance (SPI): earned value divided by planned value. Above 1.0 means ahead of schedule.
- Est. at Completion, Est. to Complete, and Variance at Completion project the final cost forward from current performance.
A health banner summarizes both indexes: green at 0.95 and above, “Slightly behind” between 0.8 and 0.95, and “At risk” below 0.8.
The S-curve
Section titled “The S-curve”The S-Curve - Planned vs Actual Cost chart plots planned value against actual cost from the project start to today. The two lines should track each other; actual cost climbing above the planned line is the earliest visual sign of an overrun.
The per-task table
Section titled “The per-task table”Below the chart, each task shows its planned cost, Earned Value, Actual Cost, and CPI, with a per-row badge telling you whether the planned cost came from the import, from rate cards, or from the budget-spread fallback.
The revenue cards
Section titled “The revenue cards”On a project marked Billable, four extra cards appear once any rate card carries a billable rate or markup: Earned Revenue, Planned Revenue, Revenue Margin, and Realization %. They mirror the cost metrics from the client-billing side. See Split cost and billable rates.
Why does my Finance tab say it needs a rate signal? The project has no imported costs and your organization has no rate cards or default hourly rate, so there is nothing honest to price work with. Onplana deliberately leaves the figures empty instead of guessing.
Why did Actual Cost not move when someone logged hours? If timesheet approval is enabled, draft and submitted hours do not count until an approver accepts them. This keeps speculative entries from red-flagging the project.
Who can see the Finance tab? Project owners and managers, plus organization owners and admins. Everyone else gets a “restricted to project managers” message.
Was this helpful?
Thanks for your feedback!