Plan on the Gantt chart
The Gantt chart draws the project as a timeline: one bar per task, arrows for dependencies, diamonds for milestones. It is where schedule problems become visible, and where you fix them by dragging.
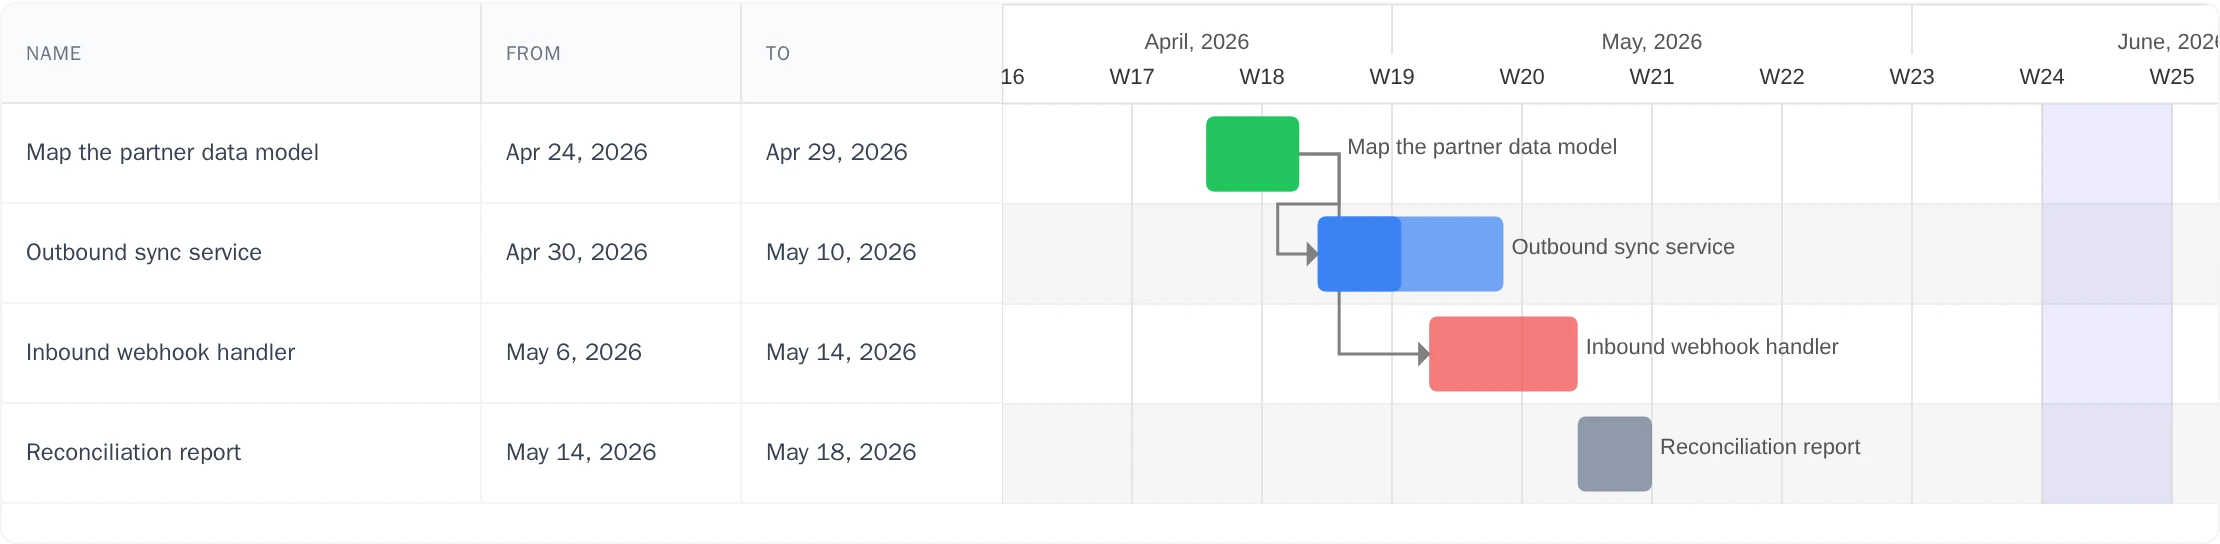
Read the chart
Section titled “Read the chart”- Bars are tasks, positioned by start and due date and colored by status.
- Arrows are dependencies between tasks, so you can trace what is waiting on what.
- Diamonds are milestones, rendered as zero-duration markers on their date.
- Zoom runs from day-level detail out to a whole-year overview.
- Expand subtasks switches between a compact top-level view and the full task hierarchy with summary bars.
Reschedule by dragging
Section titled “Reschedule by dragging”-
Open a project and select the Gantt tab in the Work section.
-
Drag a bar left or right to move the task, or drag its edge to change its duration. The task’s dates update as soon as you release.
-
Drag any empty area of the chart to pan around the timeline without hunting for scrollbars.
Focus the view
Section titled “Focus the view”- Assignee filter: show only one person’s bars to review an individual’s schedule.
- Critical path: highlight the chain of tasks that directly determines the project end date. Anything on the critical path that slips, slips the project.
- Baseline: overlay a saved snapshot of the planned schedule as grey ghost bars to see drift at a glance. See Capture and compare baselines.
Why don’t some tasks appear on the chart? A bar needs dates. Tasks without a start or due date cannot be placed on a timeline; give them dates and they appear.
Can I create dependencies from the Gantt? Dependencies are created from the task’s edit view, where you choose the link type and lag precisely. The Gantt renders them as arrows once they exist.
Does dragging a bar move its dependent tasks too? No. Dragging changes that one task’s dates. The dependency arrows make any new conflicts visible immediately, and you decide how to resolve them rather than having the chart cascade changes for you.
Was this helpful?
Thanks for your feedback!