
See why a project is over budget
The project Finance tab answers two questions on its first screen: are we over budget, and why. Under the figures of the summary strip it shows what the money was spent on, which tasks cost more than the work they earned, and how much to trust the forecast. This article covers those explanations. The figures themselves (BAC, AC, EAC, CPI and the rest) are described in Read the EVM dashboard.
The tab is shown to people who can see the project’s costs: by default the project’s owner and managers, and organization owners and admins.
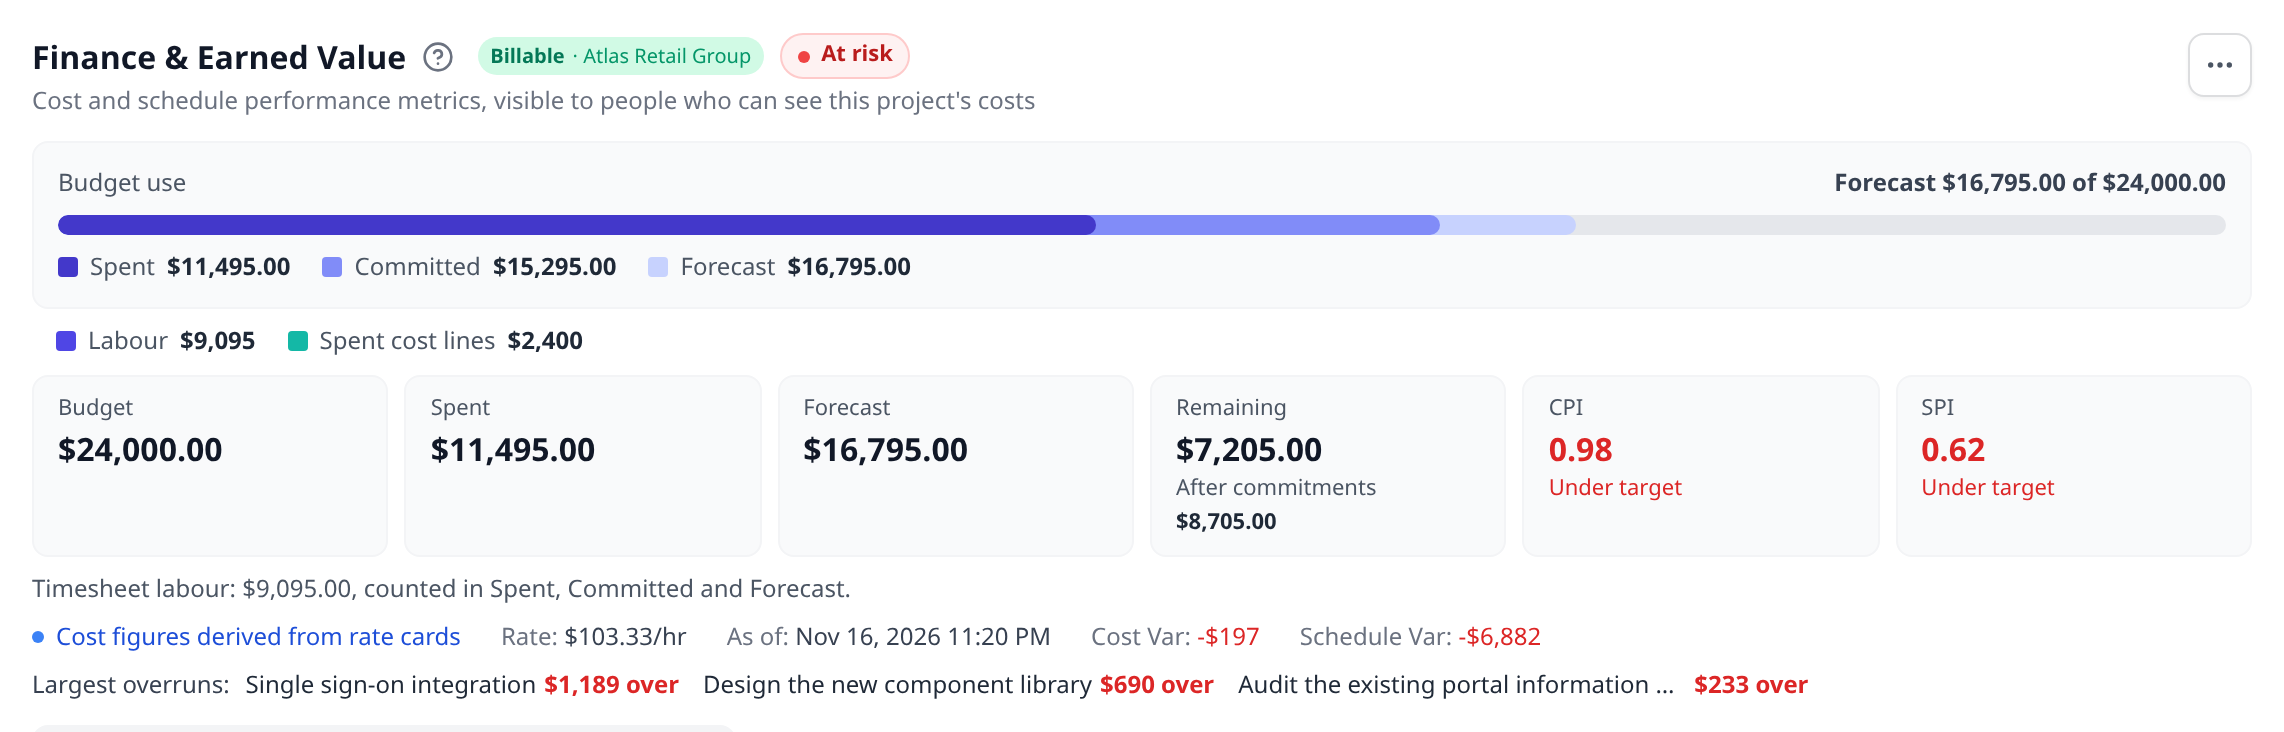
Spent so far, by kind
Section titled “Spent so far, by kind”Actual cost can come from three places, and the bar at the start of the summary strip splits it into one coloured segment each:
| Segment | Where it comes from |
|---|---|
| Labour | Approved timesheet hours, priced from rate cards |
| Approved expenses | Expense claims that were approved, in a workspace with Onplana Services |
| Spent cost lines | Cost lines with the status Spent |
A kind with nothing spent is left out. The bar is titled Spent so far, by kind and reads, for example, “Spent 18,400 of 24,000”. When the spend passes the budget, a red mark shows where the budget ends and a line under the bar says by how much, for example “Spent is 1,250 over the budget.” Otherwise the line gives the share of the budget used.
Select a kind in the legend under the bar to open the section that lists it: Task costs for labour, Expenses and revenue for expenses and Cost lines for cost lines.
On a project that keeps cost lines, the strip already shows the cost lines bar (spent, committed and forecast against the budget). The same legend then sits under that bar, so the split of actual cost is still there.
The segments always add up to the Actual cost (AC) figure, because both come from the same earned value calculation.
The Why line
Section titled “The Why line”Under the strip, a line names what is behind the spend:
- Largest overruns: up to three tasks whose actual cost is furthest above the earned value of their work so far, worst first, each with the amount, for example “Data migration 2,300 over”. Select a task to open it. Summary tasks are left out, so a phase and its own subtasks are not counted twice.
- Largest unplanned spend: the biggest amount that no task’s planned cost includes, so the budget may not cover it. That is either the approved expenses not tied to a task, or the spent cost lines not tied to a task, grouped by category, for example “Hardware cost lines, 4,500”. Select it to open the section that lists it.
A spent cost line or an expense claim that names a task is already in that task’s actual cost, so it shows up as that task’s overrun instead. Cost lines dated after today are not counted.
When nothing stands out, the line reads “No task has cost more than the work it earned.”
How far to trust the forecast
Section titled “How far to trust the forecast”On a project without cost lines, the Forecast (EAC) figure carries a short note on its basis:
- “From 42% earned. Medium confidence.” Hover over the note for the rule the forecast used: the budget divided by CPI; or what is spent plus the work still to earn at budget rates, when money is spent and nothing is earned yet; or the budget itself, when nothing has been spent.
- Below 5% of the budget earned, the forecast is a guess, so the figure reads N/A and the note says “Too early” with the share earned. The Variance (VAC) figure, which is built from the forecast, reads N/A too.
| Confidence | When |
|---|---|
| Low | Under 20% earned, or earned value comes from the budget spread evenly across tasks with no estimated hours |
| Medium | 20% to 50% earned |
| High | 50% earned or more |
A low confidence note is shown in amber, and the variance is then not coloured as good or bad.
Earned value on the S-curve
Section titled “Earned value on the S-curve”The Overview section’s chart, titled S-curve: planned, earned and actual cost, draws three lines: Planned (PV), Earned (EV) and Actual (AC). At today’s end of the chart, the gap between earned and actual is the cost variance and the gap between earned and planned is the schedule variance; hover over either gap for its amount.
The CV column in Task costs
Section titled “The CV column in Task costs”The Task costs section adds a CV column, the task’s earned value minus its actual cost. Below zero, the task has cost more than the work it earned. Select a column heading to sort by it: CV and CPI sort worst first, the amounts largest first; select the same heading again to reverse it, and a third time to return to plan order.
Under the task rows, an Other actual cost row holds the actual cost no task row carries: hours logged on summary tasks, and cost lines and expenses tied to no task. Hover over it for the split. With it, the Total row adds up to the project’s headline earned value, actual cost and cost variance.
The EVM narrative on the tab
Section titled “The EVM narrative on the tab”Generate EVM Narrative, in the Finance tab’s actions menu (the … button at the end of the header), has the Onplana agent write the numbers up in plain language. The draft goes to the agent review inbox for a person to approve.
Once a narrative is approved, the tab shows the latest one under the strip, titled with its approval date, for example “EVM narrative, approved Nov 12”. Select the title to read it, or Open the document to open it in the project’s library. When a newer draft is waiting, a line says so, with a link to the Agent inbox.
The agent saves its draft in the project, so it needs Contributor access to the project. When it does not have that access, the tab says so in place of an error:
-
Select Generate EVM Narrative.
-
If a notice says the agent can’t save the narrative on this project, and you can manage the project’s members, select Add the agent as Contributor and write it. Onplana adds the agent and starts the narrative.
-
If you cannot manage members, the notice names the people who can. Ask one of them to add the Onplana agent as a Contributor, then try again.
The narrative is an AI feature and counts toward your workspace’s AI token budget.
Why does the bar show only Labour? Nothing else has been spent. Approved expenses appear only in workspaces with Onplana Services, and spent cost lines only once the project has lines with the status Spent.
Why is the forecast N/A when the project has started? Less than 5% of the budget is earned. A forecast built on so little work moves a long way with each update, so the tab waits until there is enough to go on. Record progress on tasks to earn value.
Why is a task’s overrun not in the Largest unplanned spend? Spend tied to a task is part of that task’s actual cost, so it is counted in the task’s overrun. Largest unplanned spend holds only what no task carries.
Related
Section titled “Related”- Read the EVM dashboard, every figure on the tab
- Track project cost lines, the spent lines in the bar
- Track task costs, planned, fixed and baseline cost on each task
- Attach receipts to expense claims, the approved expenses in the bar
Was this helpful?
Thanks for your feedback!